The Repeated-Runs Effect: Why One Tool Audit Pass Catches Just Half the Bugs
LLM-based audit tools are increasingly part of production audit workflows, and most of those workflows treat each run's output as definitive. We tested that assumption — full data, scripts, and matching reports live in oddsequence/ai-audit-bench, and this article summarizes the headline finding from the repeated-runs-effect study.
TL;DR
- A single run is a coin flip. 56% mean coverage with wild variance (0–100%, std=32). You can run a tool, get nothing useful, and conclude it's broken — when it just didn't hit this time. Or get lucky once and overestimate it.
- The second run is the highest-value addition. +21 percentage points on average, bringing cumulative coverage to 77%.
- Three runs is the practical sweet spot. 89% mean coverage, median already at 100%. Most tools have found most of what they can by run three.
- Runs four and five show diminishing returns. Run 4 adds +4pp on average; run 5 adds +7pp (and is artificially inflated by our normalization — see Caveats).
LLM-based auditing is, in most settings, a stochastic process, though some tool–scope combinations are highly deterministic (24% of pairs hit 100% on run 1). A single run should not be trusted as representative.
Why we ran this
Many production workflows around AI-assisted auditing — dashboards, CI hooks, internal triage queues — implicitly treat each tool's output as deterministic. Run the tool, get findings, decide. We wanted to measure how much of a tool's actual capability a single run captures, and how the curve flattens with additional runs. The question is practical: for any tool–scope combination, how many runs do you need before you've seen most of what the tool can find?
Setup
- 6 LLM-based audit tools, anonymized as Tool 1 through Tool 6
- 5 public Web3 contest scopes (Code4rena, Cantina, Immunefi, Sherlock), anonymized as Contest 1 through Contest 5
- 5 runs per tool×scope, same mode and same model each time
- 30 tool×scope pairs total, 1 excluded (Tool 6 × Contest 3, 0 TPs across all runs); 29 valid pairs, 145 runs
- Findings compared against published contest ground truth (GT)
- We track cumulative unique TPs — distinct GT findings discovered across all runs so far
- Each tool×scope pair is normalized to its own ceiling (max cumulative TPs after run 5). 100% = "the tool found everything it's capable of finding on this scope." This isolates the repeated-run effect from absolute tool quality.
Tool and contest labels are anonymized to focus on the pattern, not the players. Per-pair details — including matching reports for every run — are in the public repository.
Headline result
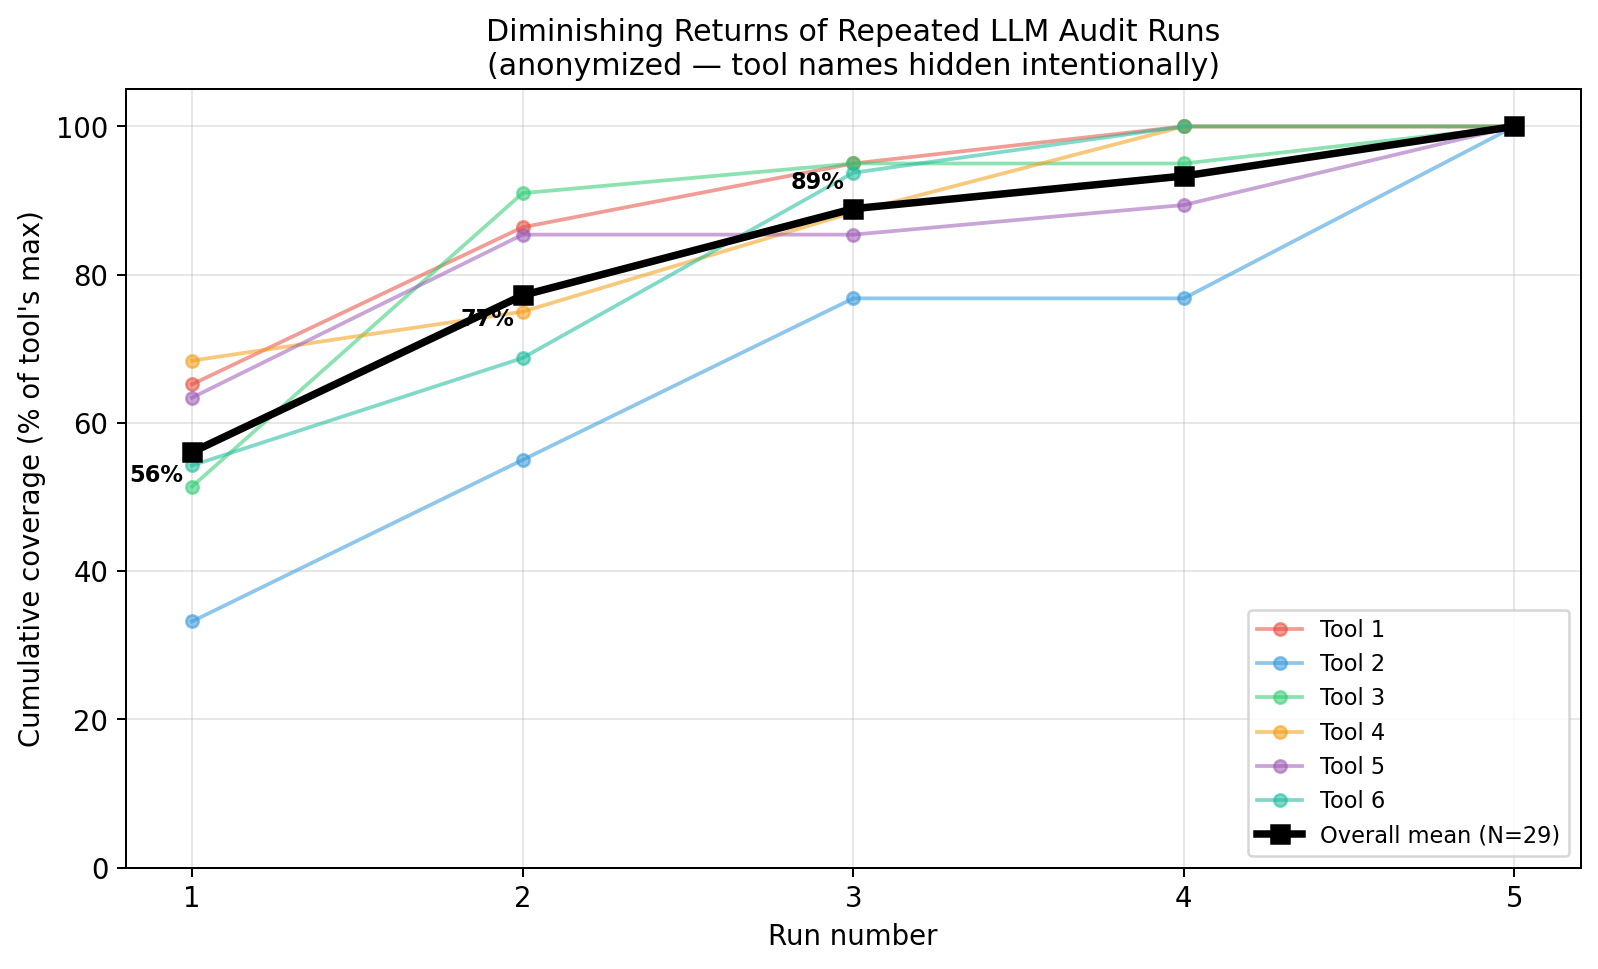
Each colored line is one tool's mean across all scopes. The bold black line is the overall mean (N=29).
Cumulative coverage by run number (% of tool's max)
| Run | Mean | Median | Std Dev | Min | Max |
|---|---|---|---|---|---|
| 1 | 56.0% | 50.0% | 32.4 | 0% | 100% |
| 2 | 77.2% | 80.0% | 25.6 | 0% | 100% |
| 3 | 88.9% | 100.0% | 15.4 | 50% | 100% |
| 4 | 93.3% | 100.0% | 14.1 | 50% | 100% |
| 5 | 100.0% | 100.0% | 0.0 | 100% | 100% |
The median crossing 100% at run 3 means that for at least half of the (tool, scope) pairs, three runs already exhausted the tool's capability on that scope. The mean is dragged down by harder pairs where the tool needs all five.
The marginal-gain story
Marginal gain per run (percentage points added)
| Run | Mean | Median | Std Dev |
|---|---|---|---|
| 1 | +56.0 | +50.0 | 32.4 |
| 2 | +21.2 | +20.0 | 24.8 |
| 3 | +11.7 | +0.0 | 23.0 |
| 4 | +4.4 | +0.0 | 10.0 |
| 5 | +6.7 | +0.0 | 14.1 |
The median marginal gain is 0 for runs 3–5, meaning in more than half of cases these runs add nothing new. But the mean stays positive — when a late run does find something new, it tends to matter. The asymmetry is itself an argument for running multiple times: you cannot tell in advance whether a given (tool, scope) pair is in the "already done after run 2" regime or the "still finding new things on run 5" regime.
Per-tool patterns
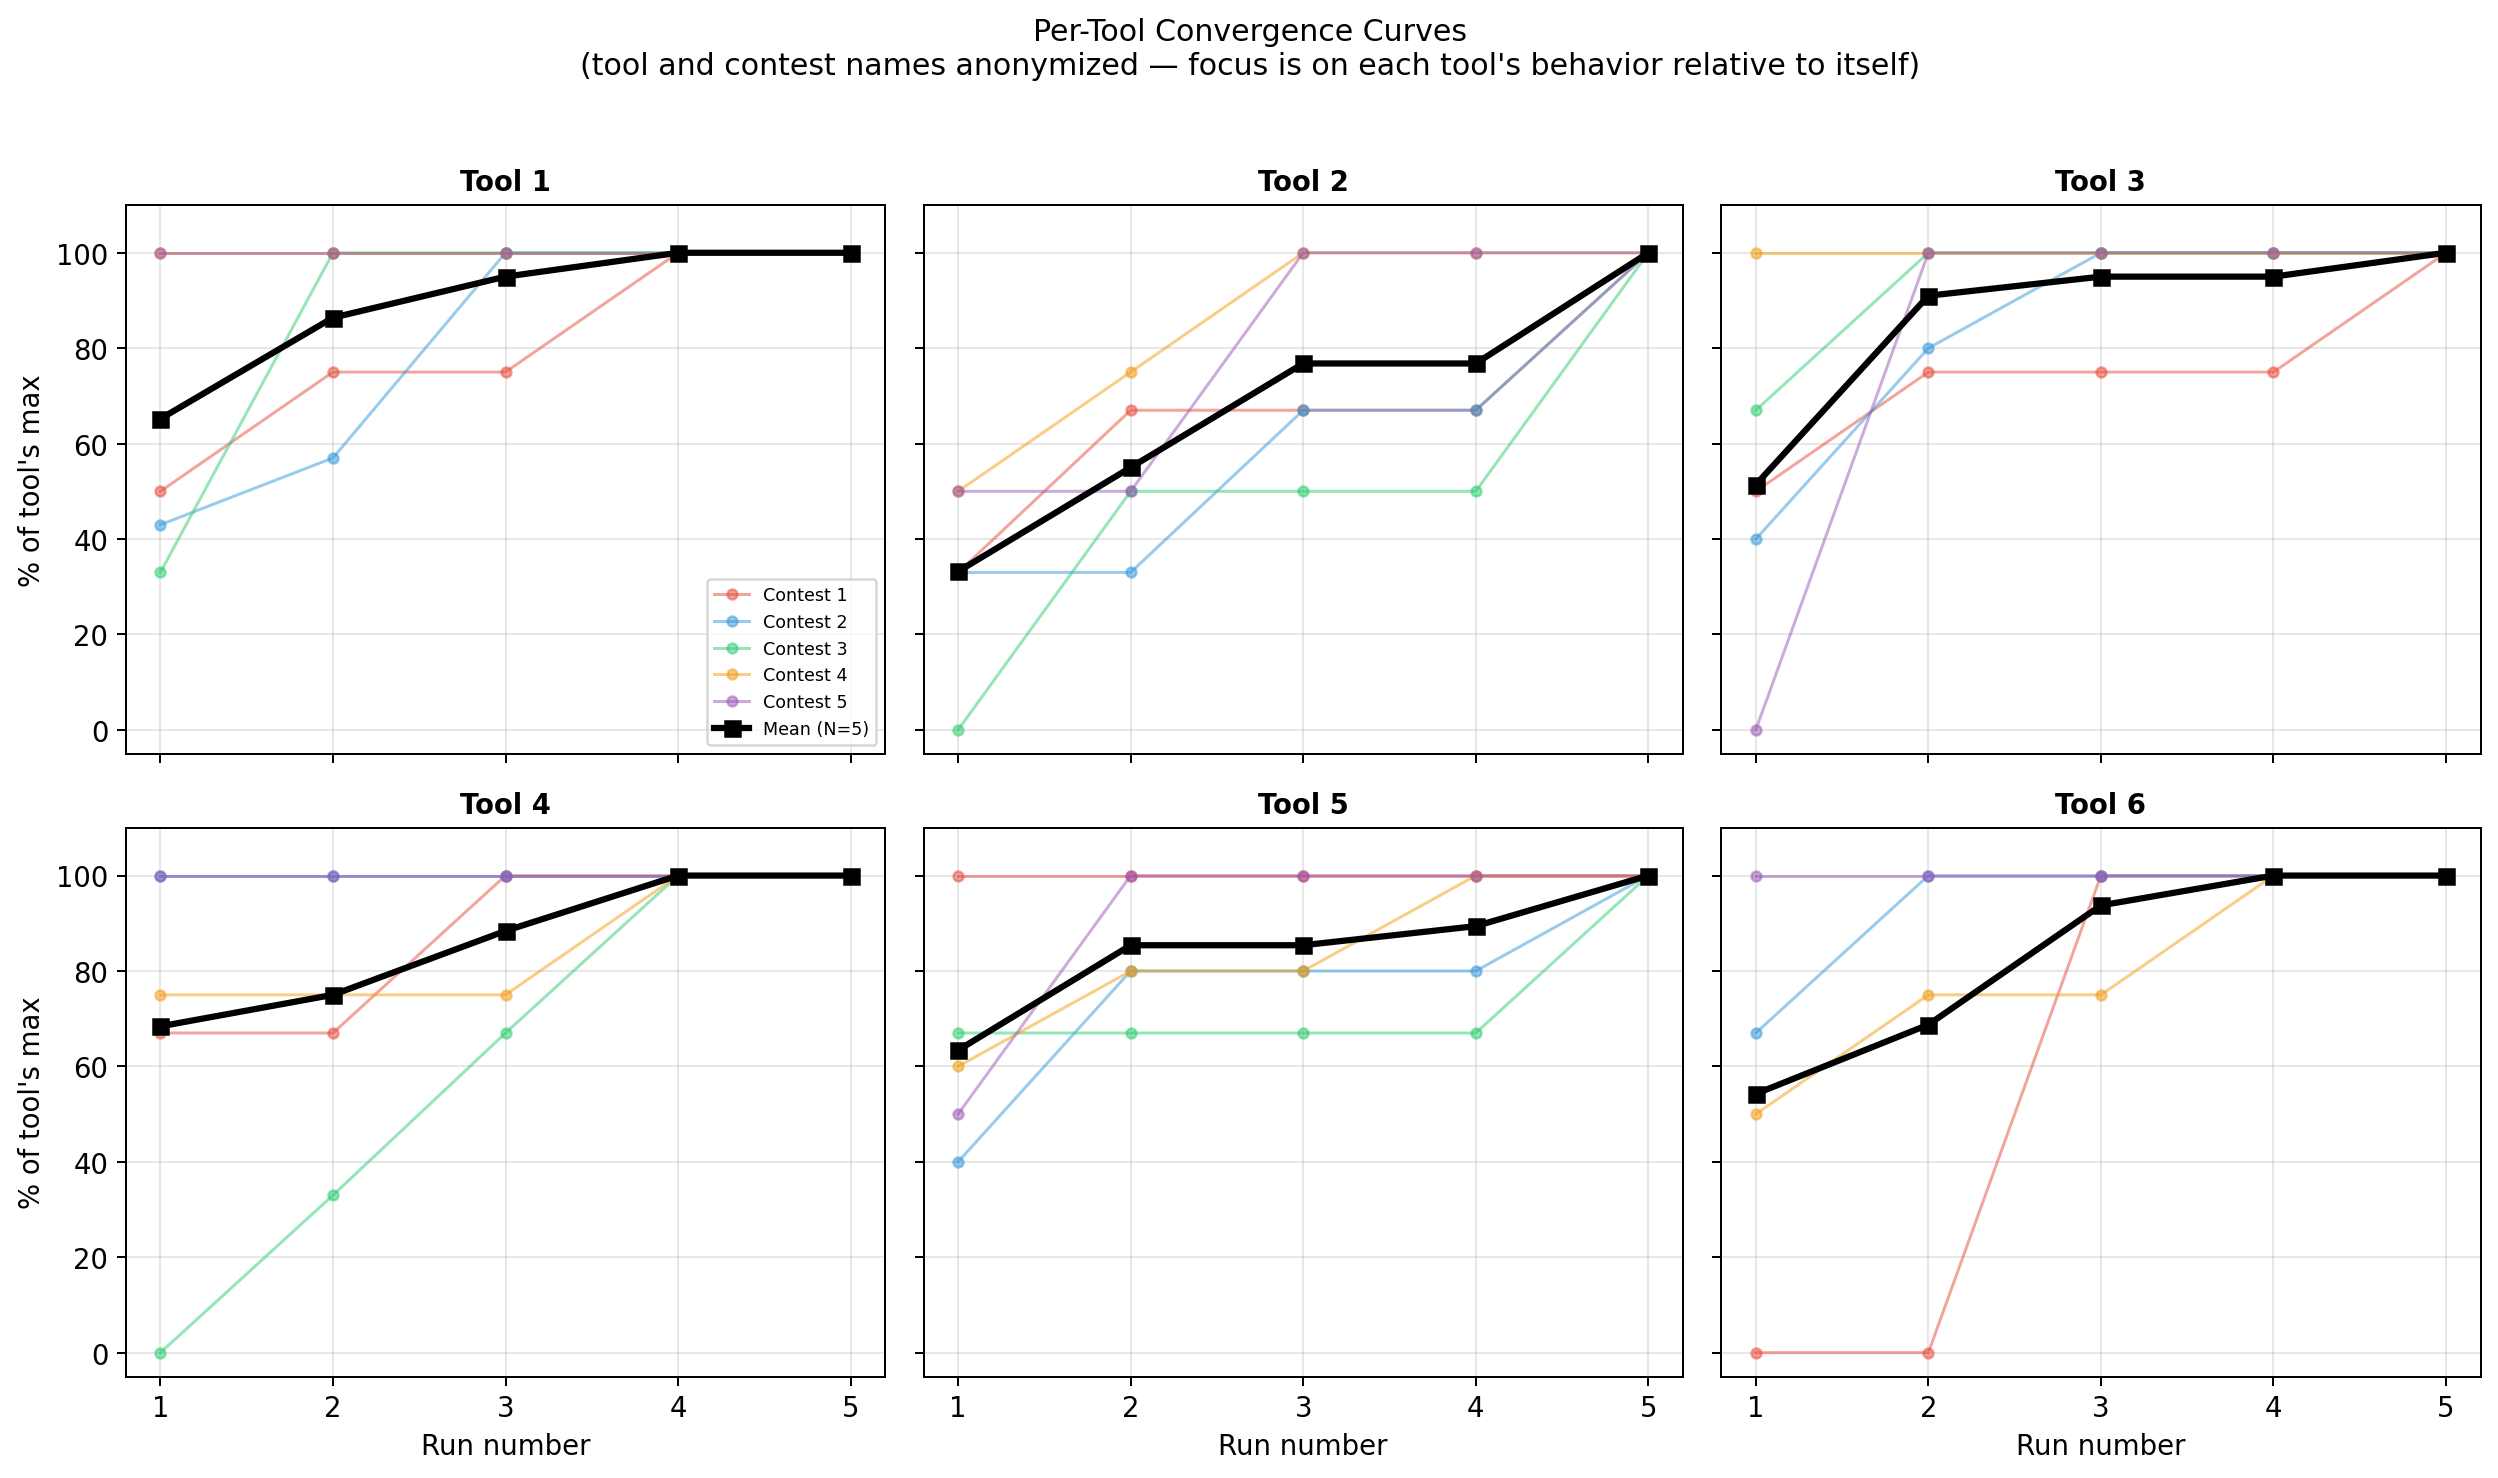
Each subplot shows one tool across all scopes. Tools converge at very different rates.
| Tool | R1 | R2 | R3 | R4 | R5 | N |
|---|---|---|---|---|---|---|
| Tool 1 | 65% | 86% | 95% | 100% | 100% | 5 |
| Tool 2 | 33% | 55% | 77% | 77% | 100% | 5 |
| Tool 3 | 51% | 91% | 95% | 95% | 100% | 5 |
| Tool 4 | 68% | 75% | 88% | 100% | 100% | 5 |
| Tool 5 | 63% | 85% | 85% | 89% | 100% | 5 |
| Tool 6 | 54% | 69% | 94% | 100% | 100% | 4 |
- Tool 2 is the slowest to converge — only 33% mean on run 1, and the only tool that needs all five runs to reach its ceiling.
- Tool 3 jumps sharply on run 2 (51% → 91%), then plateaus.
- Tool 1 starts moderately (65%) and converges by run 4.
- Tool 4 has high variance across scopes (R1 ranges from 0% to 100%).
- Tool 5 plateaus between runs 2 and 4, then picks up the last findings on run 5.
The shapes differ enough that any blanket "run N times" recommendation under-serves some tools and over-serves others.
What this means in practice
Three things follow from the data, regardless of which tool you're working with:
- Treat any single-run output as a sample, not a verdict. The variance across runs is large enough that one run gives you a biased estimate of the tool's capability on a given scope.
- Three runs is a defensible default. It captures ~89% of a tool's capability on average, and the median is already 100%. For exploratory work, this is enough.
- Architectures built on top of LLM audit agents should assume stochasticity by default. Caching the first response, or treating output as deterministic, will silently miss findings the tool was capable of catching. If five runs are affordable on critical scopes, the marginal cost is small relative to the cost of missing a finding.
Caveats
- Run 5 = 100% by construction. We normalize to the tool's max TP after all five runs, so run 5 is always 100% by definition. The run 5 row in the stats table is tautological, not an empirical finding. If we had run six times, the curve might not have reached 100% at run 5. The run 5 marginal gain (+6.7pp) is similarly inflated — it absorbs all remaining gap.
- Small denominators. 9 of 29 pairs have max TP ≤ 2. These create binary outcomes — a single lucky/unlucky hit creates a 0%→100% jump. They get equal weight to pairs with max TP of 4–7 where convergence patterns are smoother and more informative.
- GT grouping inconsistency. One tool's matching report for one of the contests uses GT=15, while the other 5 tools use GT=12 (different Low finding grouping). This doesn't affect normalized percentages (we use % of max, not % of GT) but is a data inconsistency.
- Findings not matching GT are classified as FP. Some may be valid but unreported in the contest — we accept this simplification.
- We measure a proxy: match rate against known findings. A tool finding 1 of 9 GT findings shows the same "100% convergence" as one finding 7 of 11. Absolute recall is hidden by the normalization.
- 29 data points across 6 tools. Patterns are consistent but the sample is modest.
- All runs used the same configuration per tool. Different modes or models might show different convergence patterns.
Reproducibility
Full setup, scripts, raw matching reports, and the data behind every cell of every table in this post live in oddsequence/ai-audit-bench. The directory specific to this study is researches/repeated-runs-effect/, with methodology and raw data as separate files.
If you've run a similar experiment with different tools, models, or scope sizes — we'd be interested to compare numbers.
Have corrections, additions, or feedback? We aim to keep this research accurate and up to date.
Get in Touch